autoScale                                      # default is on
alwaysZero                                     # default is off
gridDefault                                    # default is off
maxHeightPixels                       # default is 128:128:11
graphType                                  # default is bar
viewLimits                                # default is range found in data
viewLimitsMax                             # suggested bounds of viewLimits, but not enforced
yLineMark                                  # default is 0.0
yLineOnOff                                     # default is off
windowingFunction  # default is maximum, mean+whiskers is recommended
smoothingWindow                            # default is off
transformFunc                                # default is NONE
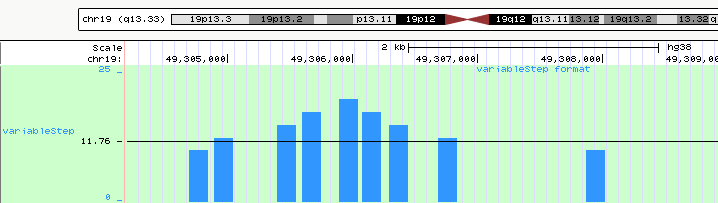
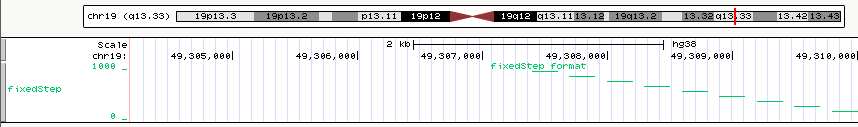
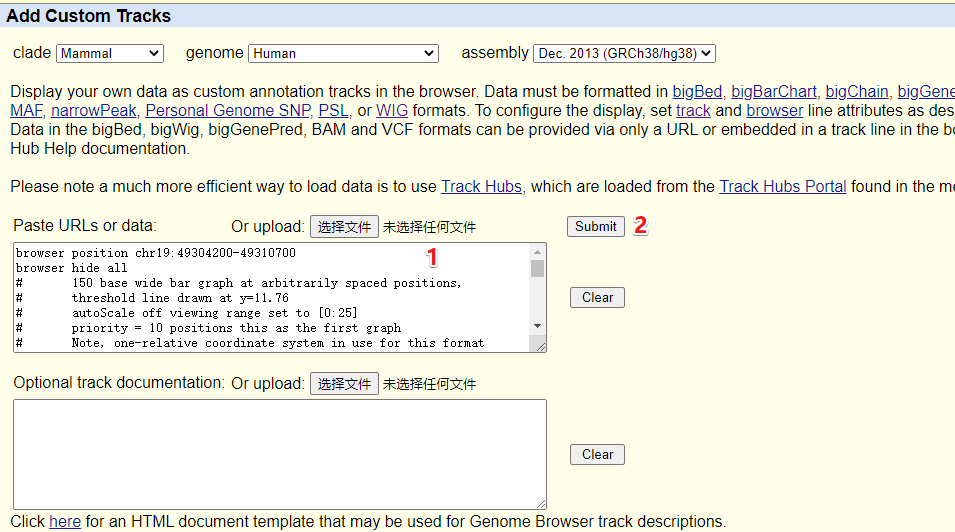
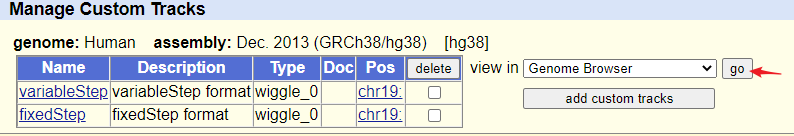
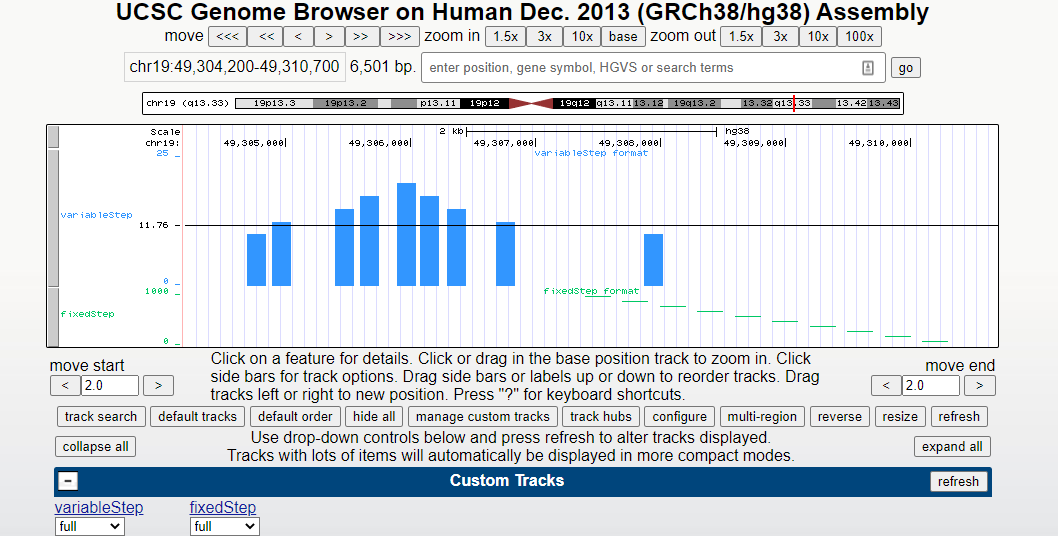
browser position chr19:49304200-49310700
browser hide all
#	150 base wide bar graph at arbitrarily spaced positions,
#	threshold line drawn at y=11.76
#	autoScale off viewing range set to [0:25]
#	priority = 10 positions this as the first graph
#	Note, one-relative coordinate system in use for this format
track type=wiggle_0 name="variableStep" description="variableStep format" visibility=full autoScale=off viewLimits=0.0:25.0 color=50,150,255 yLineMark=11.76 yLineOnOff=on priority=10
variableStep chrom=chr19 span=150
49304701 10.0
49304901 12.5
49305401 15.0
49305601 17.5
49305901 20.0
49306081 17.5
49306301 15.0
49306691 12.5
49307871 10.0
#	200 base wide points graph at every 300 bases, 50 pixel high graph
#	autoScale off and viewing range set to [0:1000]
#	priority = 20 positions this as the second graph
#	Note, one-relative coordinate system in use browser position chr19:49304200-49310700
browser hide all
#	150 base wide bar graph at arbitrarily spaced positions,
#	threshold line drawn at y=11.76
#	autoScale off viewing range set to [0:25]
#	priority = 10 positions this as the first graph
#	Note, one-relative coordinate system in use for this format
track type=wiggle_0 name="variableStep" description="variableStep format" visibility=full autoScale=off viewLimits=0.0:25.0 color=50,150,255 yLineMark=11.76 yLineOnOff=on priority=10
variableStep chrom=chr19 span=150
49304701 10.0
49304901 12.5
49305401 15.0
49305601 17.5
49305901 20.0
49306081 17.5
49306301 15.0
49306691 12.5
49307871 10.0
#	200 base wide points graph at every 300 bases, 50 pixel high graph
#	autoScale off and viewing range set to [0:1000]
#	priority = 20 positions this as the second graph
#	Note, one-relative coordinate system in use for this format
track type=wiggle_0 name="fixedStep" description="fixedStep format" visibility=full autoScale=off viewLimits=0:1000 color=0,200,100 maxHeightPixels=100:50:20 graphType=points priority=20
fixedStep chrom=chr19 start=49307401 step=300 span=200
1000
 900
 800
 700
 600
 500
 400
 300
 200
 100
 微信
微信 支付宝
支付宝